’30 Powerful Candlestick Patterns’ PDF Quick download link is given at the bottom of this article. You can see the PDF demo, size of the PDF, page numbers, and direct download Free PDF of ‘Candlestick Pattern’ using the download button.
Candlestick Pattern Book PDF Free Download
What are Candlesticks?
Put simply, candlesticks are a way of communicating information about how price is moving.
Candlestick charts are available on ThinkForex trading platforms for all assets individuals can trade on the platforms. Below is a sample of a candlestick chart derived from the ThinkForex web trading platform:
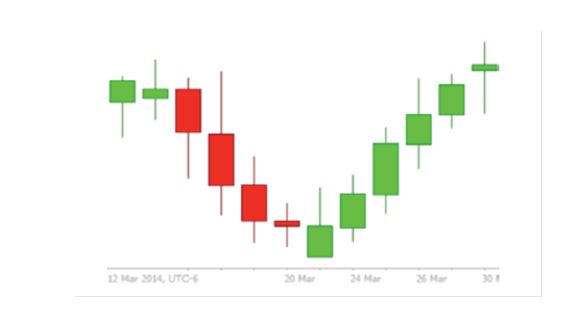
This chart shows the price on the right (vertical) axis and the time on the bottom (horizontal) axis.Moreover, the chart is made of bars that have little lines stemming from the top and the bottom; these are known as candles. The candle conveys four pieces of information:
- The open price
- The high price
- The close price
- The low price
Candles refer to that information for a specific unit of time. For instance, the chart above is a daily chart; each chart represents one day. And thus, each candle constitutes the open, close, high, and low price for that given day. The horizontal axis at the bottom of the chart can be used to understand which day corresponds to which candle. Below is an image that illustrates how those four pieces of information the open, low, high, and close for a given period of time is visualized in the context of a candle:
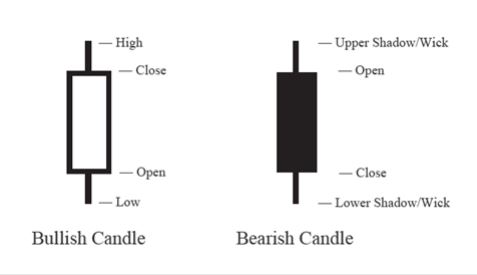
The wicks, or shadows, are the thin lines that go outside the rectangular body of the candle.
They represent the high and the low price during that time period.
The color of the candle is also significant in understanding whether the open price was higher or
lower than the close price. If the candle is red or denoted as bearish in some other manner, this
means that the open price is lower than the close, and the opposite is true if the candle is green, or denoted as bearish.
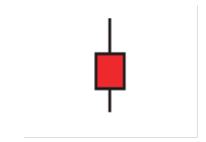
Consider the candle above. The absolute highest point on the candle, the top of the upper line above therectangular body, is the high price; the absolute lowest point shows how far price fell during the time period in question.
The top of the candle is the opening price of the time period, while the bottom of the candle is the closing price. Thus, from this candle, we see that price rallied and fell from its open but bears were ultimately able to push it lower than the open, while bulls came in before the close to push price up a bit.
| Author | – |
| Language | English |
| No. of Pages | 19 |
| PDF Size | 0.1 MB |
| Category | Econamics |
| Source/Credits | thinkmarkets.com |
Related PDFs
Managerial Economics MCQ With Answers PDF
Candlestick Pattern Book PDF Free Download