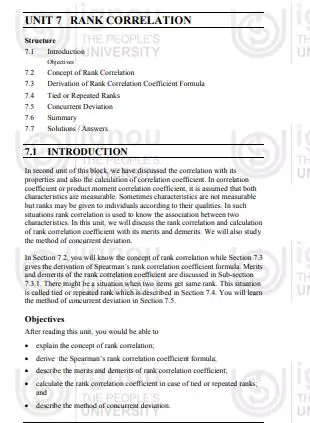
‘Spearman Rank Correlation ‘ PDF Quick download link is given at the bottom of this article. You can see the PDF demo, size of the PDF, page numbers, and direct download Free PDF of ‘Repeated Rank Correlation With Solution’ using the download button.
Spearman Rank Correlation Formulas For Repeated Ranks PDF Free Download

Rank Correlation Definition
To calculate the product moment the correlation coefficient characters must be measurable. In many practical situations, characters are not measurable.
They are qualitative characteristics and persons or things can be ranked in order of their merit. This type of situation arises when we deal with qualitative studies like honesty, beauty, voice, etc.
For example, contestants in a singing competition may be ranked by judges according to their performance. In another example, students may be ranked in different subjects according to their performance on tests.
Arranging persons or things in the order of their ability or proficiency in a specific characteristic is called ranking and the number indicating the position of persons or things is known as rank.
If ranks of individuals or objects are available for two attributes then the correlation between the ranks of these two attributes is known as rank correlation. With the help of rank correlation, we find the relationship between two qualitative characteristics.
As we know Karl Pearson’s correlation coefficient gives the intensity of the linear relationship between two variables and Spearman’s rank correlation coefficient gives the concentration of the relationship between two qualitative characteristics.
Spearman’s rank correlation coefficient measures the strength of the relationship between two ranked variables. The derivation of Spearman’s rank correlation coefficient formula is discussed in the following section.
Merits and Demerits of Rank Correlation Coefficient
Merits of Rank Correlation Coefficient:
- Spearman’s rank correlation coefficient can be interpreted similarly to Karl Pearson’s correlation coefficient;
- It is easy to understand and easy to calculate;
- If we want to see the relationship between qualitative characteristics, the rank correlation coefficient is the only formula;
- The rank correlation coefficient is a non-parametric version of Karl Pearson’s product-moment correlation coefficient; And
- It does not require the assumption of normality of the population from which the sample observations have been taken.
Demerits of Rank Correlation Coefficient
- For bivariate frequency distribution, the product-moment correlation coefficient can be calculated but the rank correlation coefficient cannot be calculated; And
- If n > 30, then this formula is time-consuming.
Tied Or Repeated Ranks In Section
It is assumed that no two or more persons or units have the same rank. But there can also be a situation when two or more persons have the same rank in one or both the attributes, then this situation is called tied.
If two or more individuals have the same value, in this case, the repeated items are allotted a common rank. This normal rank is the average of the ranks they would have received had the repetition not occurred.
For example, we have a series 50, 70, 80, 80, 85, 90 then the first rank is given to 90 as it is the largest value then 2 to 85, and now 80 is repeated twice.
Since both values are the same, a single rank will be assigned which will be the average of the ranks we would have assigned if there were no repetitions. Thus, both 80 will get the average of 3 and 4 i.e.
Spearman’s Correlation
Monotonic function
To understand Spearman’s correlation it is necessary to know what a monotonic function is. A monotonic function is one that either never increases or never decreases as its independent variable increases. The following graphs depict functions monotonically:
Monotonically increasing Monotonically decreasing Not (Rx and ry)
- Monotonically increasing – as the x variable increases the y variable never decreases;
- Monotonically decreasing – as the x variable increases the y variable never increases;
- Not monotonic – As the x variable increases, the y variable sometimes decreases and sometimes increases.
Spearman’s correlation coefficient
Spearman’s correlation coefficient is a statistical measure of the strength of a monotonic relationship between paired data. In a sample, it is denoted as follows and is bounded by design
Its interpretation is similar to Pearson’s, e.g… The closer the monogamous relationship is, the stronger it is. Correlation is an effect size and so we can verbally describe the strength of a correlation using the following guide to its absolute value:
.00-.19 “Very weak”
.20-.39 “weak”
.40-.59 “Medium”
.60-.79 “Strong”
.80-1.0 “Very Strong”
Calculating Spearman’s correlation coefficient and its subsequent significance test requires the following data assumptions:
interval or ratio scale or ordinal;
monotonously related.
Note that, unlike Pearson’s correlation, there is no requirement for normality and therefore it is a nonparametric statistic.
| Author | Spearman |
| Language | English |
| No. of Pages | 15 |
| PDF Size | 0.3 MB |
| Category | Mathematics |
| Source/Credits | egyankosh.ac.in |
Spearman Rank Correlation Coefficient Problem And Solution PDF Free Download
