‘NCERT Solutions for Class 11 Statistics Chapter 7 Correlation‘ PDF Quick download link is given at the bottom of this article. You can see the PDF demo, size of the PDF, page numbers, and direct download Free PDF of ‘Ncert Class 11 Statistics Chapter 7 Exercise Solution’ using the download button.
Correlation PDF Free Download
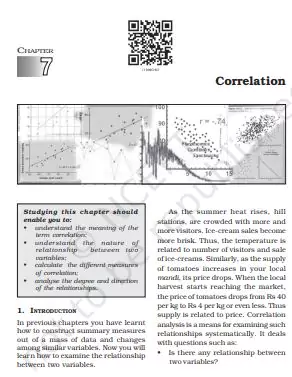
Chapter 7: Correlation
In previous chapters, you have learned how to construct summary measures out of a mass of data and changes among similar variables. Now you will learn how to examine the relationship between two variables. As the summer heat rises, hill stations, are crowded with more and more visitors. Ice cream sales become brisker.
Thus, the temperature is related to a number of visitors and sale of ice creams. Similarly, as the supply of tomatoes increases in your local mandi, its price drops. When the local harvest starts reaching the market, the price of tomatoes drops from Rs 40 per kg to Rs 4 per kg or even less. Thus supply is related to price.
Correlation analysis is a means for examining such relationships systematically. It deals with questions such as: • Is there any relationship between two variables?
TYPES OF RELATIONSHIP
Let us look at various types of relationships. The relation between movements in quantity demanded and the price of a commodity is an integral part of the theory of demand, which you will study in Class XII. Low agricultural productivity is related to low rainfall. Such examples of relationships may be given a cause-and-effect interpretation.
Others may be just coincidence. The relation between the arrival of migratory birds in a sanctuary and the birth rates in the locality cannot be given any cause-and-effect interpretation. The relationships are simple coincidences.
The relationship between the size of the shoes and the money in your pocket is another such example. Even if relationships exist, they are difficult to explain it. In another instance, a third variable’s impact on two variables may give rise to a relation between the two variables. Brisk sale of ice creams may be related to higher number of deaths due to drowning.
The victims are not drowned due to eating of icecreams. Rising temperature leads to brisk sale of ice-creams. Moreover, large number of people start going to swimming pools to beat the heat. This might have raised the number of deaths by drowning.
Thus, the temperature is behind the high correlation between the sale of ice creams and deaths due to drowning. What Does Correlation Measure? Correlation studies and measures the direction and intensity of relationships among variables. Correlation measures covariation, not causation. Correlation should never be interpreted as implying cause and effect relation.
The presence of correlation between two variables X and Y simply means that when the value of one variable is found to change in one direction, the value of the other variable is found to change either in the same direction (i.e. positive change) or in the opposite direction (i.e. negative change), but in a definite way.
For simplicity we assume here that the correlation if it exists, is linear, i.e. the relative movement of the two variables can be represented by drawing a straight line on graph paper. Types of Correlation Correlation is commonly classified into negative and positive correlation.
The correlation is said to be positive when the variables move together in the same direction. When income rises, consumption also rises. When income falls, consumption also falls. Sale of icecream and temperature move in the same direction.
The correlation is negative when they move in opposite directions. When the price of apples falls its demand increases. When the prices rise its demand decreases. When you spend more time in studying, chances of your failing decline. When you spend less hours in your studies, chances of scoring low marks/grades increase. These are instances of negative correlation. The variables move in opposite direction.
| Author | NCERT |
| Language | English |
| No. of Pages | 16 |
| PDF Size | 1.7 MB |
| Category | Statistics |
| Source/Credits | ncert.nic.in |
NCERT Solutions Class 11 Statistics Chapter 7 Correlation
Question 1.
The unit of correlation coefficient between height in feet and weight in kgs is
(a) kg/feet
(b) percentage
(c) non-existent
Answer:
(c) Correlation coefficient (r) has no unit. It is a pure number. It meansss units of measurement are not part of r.
Question 2.
The range of simple correlation coefficient is
(a) 0 to infinity
(b) minus one to plus one
(c) minus infinity to infinity
Answer:
(b) The value of the correlation coefficient lies between minus one and plus one, -1 ≤ r ≤ 1. If the value of r is outside this range it indicates error in calculation.
Statistics for Economics Class 11 NCERT Solutions Chapter 7 Correlation
Question 1.
The unit of correlation coefficient between height in feet and weight in kgs is
(a) kg/feet
(b) percentage
(c) non-existent
Answer:
(c) Correlation coefficient (r) has no unit. It is a pure number. It meansss units of measurement are not part of r.
Question 2.
The range of simple correlation coefficient is
(a) 0 to infinity
(b) minus one to plus one
(c) minus infinity to infinity
Answer:
(b) The value of the correlation coefficient lies between minus one and plus one, -1 ≤ r ≤ 1. If the value of r is outside this range it indicates error in calculation.
Question 3.
If rXY is positive the relation between X and Y is of the type
(a) when Y increases X increases
(b) when Y decreases X increases
(c) when Y increases X does not change
Answer:
(a) If r is positive the two variables move in the same direction. e.g., when the price of coffee rises, the demand for tea also rises as coffee is a substitute of tea. Therefore, the r between price of coffee and demand for tea will be positive.
NCERT Class 11 Statistics Textbook Chapter 7 With Answer PDF Free Download