‘PVSRA (Price/Volume/S&R Analysis)’ PDF Quick download link is given at the bottom of this article. You can see the PDF demo, size of the PDF, page numbers, and direct download Free PDF of ‘Technical Analysis Based On Price-Volume Signals’ using the download button.
Complete Guide To Volume Price Analysis Book PDF Free Download
PVSRA
use a lot of different indicators and methods, but one that has been consistently successful
is the price/volume relationship at support and resistance levels.
Support or resistance areas occur at previous highs and lows.
Prices bounce off previous highs and lows and develop trading ranges.
I will show you how price and volume react to previous highs and lows, and why price pushes through or reverses at these points.
SWINGS
Previous highs and lows in a stock or index define current support and resistance areas. A previous high or low in a stock or index is referred to as a swing.
I draw a horizontal trendline from the previous swing high or low to determine at what price support or resistance will appear in the future.
These previous swing highs and lows are points where I make decisions for placing buy or sell orders.
The horizontal lines drawn from previous highs and lows indicate where the support or resistance may come in.
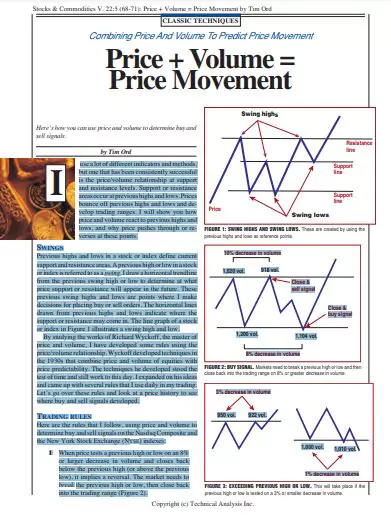
The line graph of a stock or index in Figure 1 illustrates a swing high and low.
By studying the works of Richard Wyckoff, the master of price and volume, I have developed some rules using the price/volume relationship.
Wyckoff developed techniques in the 1930s that combine price and volume of equities with price predictability.
The techniques he developed stood the test of time and still work to this day. I expanded on his ideas and came up with several rules that I use daily in my trading.
Let’s go over these rules and look at a price history to see where buy and sell signals developed.
TRADING RULES
Here are the rules that I follow, using price and volume to determine buy and sell signals on the Nasdaq Composite and the New York Stock Exchange (NYSE) indexes: 10% decrease in volume 8% decrease in volume Close & buy signal 1,104 vol.
Close & sell signal 1,200 vol. 1,020 vol. 918 vol. 1% decrease in volume 3% decrease in volume
1,010 vol. 1,000 vol. 950 vol. 922 vol.
1 When price tests a previous high or low on an 8% or larger decrease in volume and closes back below the previous high (or above the previous low), it implies a reversal.
The market needs to break the previous high or low, then close back into the trading range (Figure 2).
2 When price tests a previous high or low on a 3% or smaller decrease in volume, it implies that the high or low will be exceeded (Figure 3).
3 Always compare the volume relationship to the first high or low, even on the third and fourth retest.
The buy and sell signal relationship stays the same (Figures 4A and 4B).
It’s not the volume figure that is important on a retest of previous highs or lows, but the percentage increase or decrease in volume relative to previous highs or lows.
These volume relationships will signal if the market will pass through or reverse at these previous highs and lows.
4 When markets break to new highs (or lows) on near-equal or increased volume, then reverse back into the trading range, the last high (or low) will be at least tested, and possibly rally through to the next swing high or low (Figure 5).
But how do you tell if the last high (or low) will be tested and then reverse or continue through? The answer lies in the volume.
• If volume is at least 8% lighter on the test of high (or low), then expect a reversal.
• If volume is within 3% on the test, then expect continuation.
5 Markets that break to new highs or lows on 8% or greater decrease in volume and close outside of the trading range imply a false break and will come back into the trading range (Figure 6).
6 Tops and bottoms of gaps act and work the same way as previous highs/lows and previous support/resistance zones.
The same volume percent relationship works with the gaps as with retest of previous highs and lows (Figure 7).
| Author | – |
| Language | English |
| No. of Pages | 3 |
| PDF Size | 1 MB |
| Category | Stock Market |
| Source/Credits | n.b5z.net |
Related PDFs
The Theory of Investment Value PDF By J B Williams
Profit And Loss Questions And Answers PDF
Complete Guide To Volume Price Analysis Book PDF Free Download