‘NCERT Solutions for Class 11 Statistics Chapter 4 Presentation of Data‘ PDF Quick download link is given at the bottom of this article. You can see the PDF demo, size of the PDF, page numbers, and direct download Free PDF of ‘Ncert Class 11 Statistics Chapter 4 Exercise Solution’ using the download button.
Presentation Of Data Book PDF Free Download
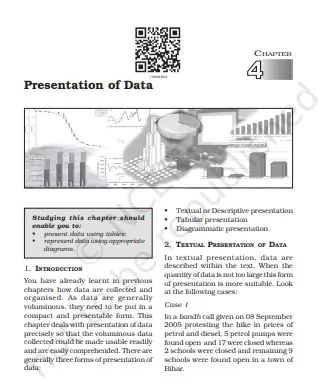
Chapter 4: Presentation of Data
As data are generally voluminous, they need to be put in a compact and presentable form. This chapter deals with presentation of data precisely so that the voluminous data collected could be made usable readily and are easily comprehended. There are generally three forms of presentation of data: Textual or Descriptive presentation • Tabular presentation • Diagrammatic presentation.
TEXTUAL PRESENTATION OF DATA
In textual presentation, data are described within the text. When the quantity of data is not too large this form of presentation is more suitable. Look at the following cases: Case 1 In a bandh call given on 08 September 2005 protesting the hike in prices of petrol and diesel, 5 petrol pumps were found open and 17 were closed whereas 2 schools were closed and remaining 9 schools were found open in a town of Bihar.
Case 2 Census of India 2001 reported that Indian population had risen to 102 crore of which only 49 crore were females against 53 crore males. Seventy-four crore people resided in rural India and only 28 crore lived in towns or cities. While there were 62 crore non-worker population against 40 crore workers in the entire country.
Urban population had an even higher share of non-workers (19 crore) against workers (9 crore) as compared to the rural population where there were 31 crore workers out of a 74 crore population… In both the cases data have been presented only in the text.
A serious drawback of this method of presentation is that one has to go through the complete text of presentation for comprehension. But, it is also true that this matter often enables one to emphasise certain points of the presentation.
TABULAR PRESENTATION OF DATA
In a tabular presentation, data are presented in rows (read horizontally) and columns (read vertically). For example see Table 4.1 tabulating information about literacy rates. It has three rows (for male, female and total) and three columns (for urban, rural and total). It is called a 3 × 3 Table giving 9 items of information in 9 boxes called the “cells” of the Table. Each cell gives information that relates an attribute of gender (“male”, “female” or total) with a number (literacy percentages of rural people, urban people and total).
The most important advantage of tabulation is that it organises data for further statistical treatment and decisionmaking. Classification used in tabulation is of four kinds: • Qualitative • Quantitative • Temporal and • Spatial Qualitative classification When classification is done according to attributes, such as social status, physical status, nationality, etc., it is called qualitative classification. For example, in Table 4.1 the attributes for classification are sex and location which are qualitative in nature.
DIAGRAMMATIC PRESENTATION OF DATA
This is the third method of presenting data. This method provides the quickest understanding of the actual situation to be explained by data in comparison to tabular or textual presentations. Diagrammatic presentation of data translates quite effectively the highly abstract ideas contained in numbers into more concrete and easily comprehensible form.
Diagrams may be less accurate but are much more effective than tables in presenting the data. There are various kinds of diagrams in common use. Amongst them the important ones are the following: (i) Geometric diagram (ii) Frequency diagram (iii) Arithmetic line graph Geometric Diagram Bar diagram and pie diagram come in the category of geometric diagram.
The bar diagrams are of three types — simple, multiple and component bar diagrams. Bar Diagram Simple Bar Diagram Bar diagram comprises a group of equispaced and equiwidth rectangular bars for each class or category of data. Height or length of the bar reads the magnitude of data.
The lower end of the bar touches the base line such that the height of a bar starts from the zero unit. Bars of a bar diagram can be visually compared by their relative height and accordingly data are comprehended quickly. Data for this can be of frequency or non-frequency type. In non-frequency type data a particular characteristic, say production, yield, population, etc. at various points of time or of different states are noted and corresponding bars are made of the respective heights according to the values of the characteristic to construct the diagram.
| Author | NCERT |
| Language | English |
| No. of Pages | 18 |
| PDF Size | 2 MB |
| Category | Statistics |
| Source/Credits | ncert.nic.in |
NCERT Solutions Class 11 Statistics Chapter 4 Presentation of Data
Question 1.
Bar diagram is a
(a) one-dimensional diagram
(b) two-dimensional diagram
(c) diagram with no dimension
(d) None of these
Answer:
(a) Bar diagrams are one-dimensional diagrams. Though these are represented on a plane of two axis in form of rectangular bars, the width is of no consequence and only the length depicts the frequency.
Question 2.
Data represented through a histogram can help in finding graphically the
(a) mean
(b) mode
(c) median
(d) All of these
Answer:
(b) Histogram gives value of mode of the frequency distribution graphically through the highest rectangle
Question 3.
Ogives can be helpful in locating graphically the
(a) mode
(b) mean
(c) median
(d) None of these
Answer:
(c) Intersection point of the less than and more than ogives gives the median.
NCERT Class 11 Statistics Textbook Chapter 4 With Answer PDF Free Download