Statistics Chapter 15 Class 11 Maths NCERT Textbook With Solutions PDF

NCERT Solutions for Class 11 Maths Chapter 15 PDF Quick download link is given at the bottom of this article. You can see the PDF demo, size of the PDF, page numbers, and direct download Free PDF of ‘Ncert Class 11 Maths Chapter 15 Exercise Solution’ using the download button.

NCERT Class 11 Maths Textbook Chapter 15 With Answer Book PDF Free Download
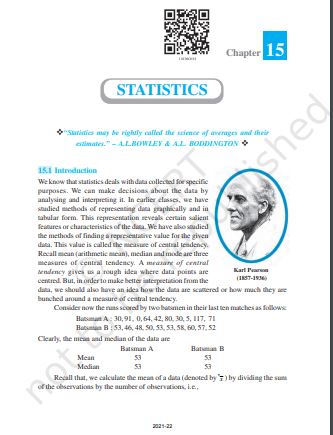
Statistics

Chapter 15: Statistics

15.1 Introduction

We know that statistics deals with data collected for specific purposes. We can make decisions about the data by analyzing and interpreting it.

In earlier classes, we have studied methods of representing data graphically and in tabular form.

This representation reveals certain salient features or characteristics of the data. We have also studied the methods of finding a representative value for the given data.

This value is called the measure of central tendency. Recall mean (arithmetic mean), median and mode are three measures of central tendency.

A measure of central tendency gives us a rough idea of where data points are centered.

But, in order to make a better interpretation of the data, we should also have an idea of how the data are scattered or how much they are bunched around a measure of central tendency.

Consider now the runs scored by two batsmen in their last ten matches as follows:
Batsman A : 30, 91, 0, 64, 42, 80, 30, 5, 117, 71
Batsman B : 53, 46, 48, 50, 53, 53, 58, 60, 57, 52
Clearly, the mean and median of the data are Batsman A Batsman B
Mean 53 53
Median 53 53
Recall that, we calculate the mean of a data (denoted by x ) by dividing the sum
of the observations by the number of observations, i.e

AuthorNCERT
Language English
No. of Pages36
PDF Size2.5 MB
CategoryMathematics
Source/Creditsncert.nic.in

NCERT Solutions Class 11 Maths Chapter 15 Statistics

Find the mean deviation about the mean for the data in Exercises 1 and 2.

1. 4, 7, 8, 9, 10, 12, 13, 17

Solution:-

First we have to find (x̅) of the given data

NCERT Soluitons for Class 11 Maths Chapter 15 Statistics Image 1

So, the respective values of the deviations from mean,

i.e., xi – x̅ are, 10 – 4 = 6, 10 – 7 = 3, 10 – 8 = 2, 10 – 9 = 1, 10 – 10 = 0,

10 – 12 = – 2, 10 – 13 = – 3, 10 – 17 = – 7

6, 3, 2, 1, 0, -2, -3, -7

Now absolute values of the deviations,

6, 3, 2, 1, 0, 2, 3, 7

NCERT Soluitons for Class 11 Maths Chapter 15 Statistics Image 2

MD = sum of deviations/ number of observations

= 24/8

= 3

So, the mean deviation for the given data is 3.

2. 38, 70, 48, 40, 42, 55, 63, 46, 54, 44

Solution:-

First we have to find (x̅) of the given data

NCERT Soluitons for Class 11 Maths Chapter 15 Statistics Image 3

So, the respective values of the deviations from mean,

i.e., xi – x̅ are, 50 – 38 = -12, 50 -70 = -20, 50 – 48 = 2, 50 – 40 = 10, 50 – 42 = 8,

50 – 55 = – 5, 50 – 63 = – 13, 50 – 46 = 4, 50 – 54 = -4, 50 – 44 = 6

-12, 20, -2, -10, -8, 5, 13, -4, 4, -6

Now absolute values of the deviations,

12, 20, 2, 10, 8, 5, 13, 4, 4, 6

NCERT Soluitons for Class 11 Maths Chapter 15 Statistics Image 4

MD = sum of deviations/ number of observations

= 84/10

= 8.4

So, the mean deviation for the given data is 8.4.

Find the mean deviation about the median for the data in Exercises 3 and 4.

3. 13, 17, 16, 14, 11, 13, 10, 16, 11, 18, 12, 17

Solution:-

First we have to arrange the given observations into ascending order,

10, 11, 11, 12, 13, 13, 14, 16, 16, 17, 17, 18.

The number of observations is 12

Then,

Median = ((12/2)th observation + ((12/2)+ 1)th observation)/2

(12/2)th observation = 6th = 13

(12/2)+ 1)th observation = 6 + 1

= 7th = 14

Median = (13 + 14)/2

= 27/2

= 13.5

So, the absolute values of the respective deviations from the median, i.e., |xi – M| are

3.5, 2.5, 2.5, 1.5, 0.5, 0.5, 0.5, 2.5, 2.5, 3.5, 3.5, 4.5

NCERT Soluitons for Class 11 Maths Chapter 15 Statistics Image 5

Mean Deviation,

NCERT Soluitons for Class 11 Maths Chapter 15 Statistics Image 6

= (1/12) × 28

= 2.33

So, the mean deviation about the median for the given data is 2.33.

4. 36, 72, 46, 42, 60, 45, 53, 46, 51, 49

Solution:-

First we have to arrange the given observations into ascending order,

36, 42, 45, 46, 46, 49, 51, 53, 60, 72.

The number of observations is 10

Then,

Median = ((10/2)th observation + ((10/2)+ 1)th observation)/2

(10/2)th observation = 5th = 46

(10/2)+ 1)th observation = 5 + 1

= 6th = 49

Median = (46 + 49)/2

= 95

= 47.5

So, the absolute values of the respective deviations from the median, i.e., |xi – M| are

11.5, 5.5, 2.5, 1.5, 1.5, 1.5, 3.5, 5.5, 12.5, 24.5

NCERT Soluitons for Class 11 Maths Chapter 15 Statistics Image 7

Mean Deviation,

NCERT Soluitons for Class 11 Maths Chapter 15 Statistics Image 8

= (1/10) × 70

= 7

So, the mean deviation about the median for the given data is 7.

Find the mean deviation about the mean for the data in Exercises 5 and 6.

5.

xi510152025
fi74635

Solution:-

Let us make the table of the given data and append other columns after calculations.

Xififixi|xi – x̅|fi |xi – x̅|
5735963
10440416
1569016
20360618
2551251155
25350158

The sum of calculated data,

NCERT Soluitons for Class 11 Maths Chapter 15 Statistics Image 9

The absolute values of the deviations from the mean, i.e., |xi – x̅|, as shown in the table.

NCERT Soluitons for Class 11 Maths Chapter 15 Statistics Image 10

NCERT Class 11 Maths Textbook Chapter 15 With Answer Book PDF Free Download

Leave a Comment

Your email address will not be published. Required fields are marked *