Data Handling Chapter 3 Class 7 Maths NCERT Textbook With Solutions PDF

NCERT Solutions for Class 7 Maths Chapter 3 ‘ PDF Quick download link is given at the bottom of this article. You can see the PDF demo, size of the PDF, page numbers, and direct download Free PDF of ‘Ncert Class 7 Maths Chapter 3 Exercise Solution’ using the download button.

NCERT Class 7 Maths Textbook Chapter 3 With Answer PDF Free Download
NCERT Class 7 Maths Textbook Chapter 3 With Answer PDF

Chapter 3: Data Handling

Introduction

In your previous classes, you have dealt with various types of data. You have learned to collect data, tabulate and put it in the form of bar graphs.

The collection, recording, and presentation of data help us organize our experiences and draw inferences from them.

In this chapter, we will take one more step towards learning how to do this. You will come across some more kinds of data and graphs.

You have seen several kinds of data through newspapers, magazines, television, and other sources. You also know that all data give us some sort of information.

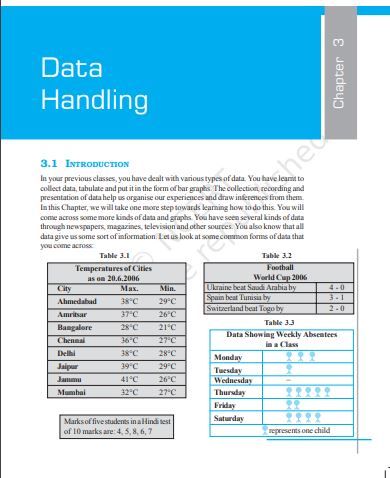
Let us look at some common forms of data that you come across

What do these collections of data tell you?

For example, you can say that the highest maximum temperature was in Jammu on 20.06.2006 (Table 3.1) or we can say that, on Wednesday, no child was absent. (Table 3.3)

Can we organize and present these data in a different way, so that their analysis and interpretation become better? We shall address such questions in this Chapter.

Collecting Data

The data about the temperatures of cities (Table 3.1) can tell us many things, but it cannot tell us the city which had the highest maximum temperature during the year.

To find that, we need to collect data regarding the highest maximum temperature reached in each of these cities during the year.

In that case, the temperature chart of one particular date of the year, as given in Table 3.1 will not be sufficient. This shows that a given collection of data may not give us specific information related to that data.

For this, we need to collect data keeping in mind that specific information. In the above case the specific information needed by us was about the highest maximum temperature of the cities during the year, which we could not get from Table 3.1 Thus, before collecting data, we need to know what we would use it for.

Given below are a few situations. You want to study the – Performance of your class in Mathematics.
– Performance of India in football or in cricket.
– Female literacy rate in a given area, or
– Number of children below the age of five in the families around you.

What kind of data would you need in the above situations? Unless and until you collect appropriate data, you cannot know the desired information. What is the appropriate data for each?

Discuss with your friends and identify the data you would need for each. Some of this data is easy to collect and some difficult.

Organisation Of Data

When we collect data, we have to record and organize it. Why do we need to do that?

Consider the following example.
Ms Neelam, class teacher wanted to find how children had performed in English. She writes down the marks obtained by the students in the following way:
23, 35, 48, 30, 25, 46, 13, 27, 32, 38
In this form, the data was not easy to understand. She also did not know whether her impression of the students matched their performance.

AuthorNCERT
Language English
No. of Pages20
PDF Size563 KB
CategoryMathematics
Source/ Creditsncert.nic.in

NCERT Solutions Class 7 Maths Chapter 3 Data Handling

Q1. The scores in mathematics test (out of 25) of 15 students follow:
19, 25, 23, 20, 9, 20, 15, 10, 5, 16, 25, 20, 24, 12, 20. Find the mode and median of the data. Are they the same?

Solution: –
Scores of 15 students in mathematics test are:
19, 25, 23, 20, 9, 20, 15, 10, 5 16, 25, 20, 24, 12, 20.
Arranging scores in ascending order, we get
5, 9, 10, 12, 15, 16, 19, 20, 20, 20, 20, 23, 24, 25, 25
Mode – Mode of a given data is that value of observation that occurs for the most number of times.
Therefore, 20 occurs most of the time.
∴ Mode = 20.
Median = middle of observation (in this case, 8th observation)
∴ Median = 20
Yes, the mode and median of the given observations are the same.

Q2. The weights (in kg) of 15 students of a class are:
38, 42, 35, 37, 45, 50, 32, 43,43, 40, 36, 38, 43, 38,47
(i) Find the median and mode of this data.
(ii) Is there more than one mode?

Solution: –

Total number of students =15
Weights of 15 students = 38, 42, 35, 37, 45, 50, 32, 43,43, 40, 36, 38, 43, 38, 47.
Arranging in ascending order,we get 32, 35, 36,37,38, 38,38,40, 42, 43, 43,43, 45, 47, 50
(i). Mode is the observation that occurred the highest number of times.
Thus, 38 and 43 occur the highest number of times.
∴ Mode = 38 and 43.
Also, median = 40 (8th observation)
(ii). Yes, there are two modes

Data Handling Chapter 3 Class 7 Maths NCERT Textbook With Solutions PDF

Leave a Comment

Your email address will not be published. Required fields are marked *